The ‘digital twin’ in our project serves as more than just a digital replica of the physical world. It acts as a central hub, seamlessly integrating various research dimensions, including architecture, social aspects, the environment, and economics, into a unified digital platform. This holistic approach enables us to comprehensively evaluate, validate, and cross-verify our research findings.
To make these insights more accessible and engaging, we have developed an immersive Virtual Reality (VR) experience that showcases a digitally sustainable area within the one-north district in Singapore. This VR environment transforms our core research insights into interactive 3D models and offers two distinct scenarios for exploration. Through this interactive platform, we aim to engage the public, providing a clear demonstration of how our proposed planning and design strategies enhance both liveability and vibrancy in sustainable integrated districts.

Figure 1, Digital Twins
In addition to the capability to present our research via virtual reality, this represents merely one among several advantages inherent in the migration of our research onto a digital platform.[fig 1] An integral outcome of this initiative will encompass the digitization of our primary case studies, namely One North, Jurong Gateway, and Punggol Digital District, followed by the systematic compilation of our research findings, including the formulation of innovative design solutions and strategic approaches.
VR SCENARIO
Location: Central exchange green street, One-north, Singapore
Description: Immersive experience from the street level of sustainable integrated district’s digital platform.

Fig 2, 360 degree synthetic data frame from Digital twin
In this scenario, we delve into the implementation of mixed-use planning and design strategies, focusing on enhancing social vibrancy within sustainable integrated districts. Leveraging state-of-the-art Virtual Reality (VR) modelling, we meticulously reconstruct the pedestrian pathways and transportation infrastructure of one-north. This simulation allows us to study people movement dynamics and traffic flow. Through precise adjustments of various parameters, including urban and architectural layouts and amenity composition, we observe a significant uptick in pedestrian engagement across diverse street-level activities. Consequently, the urban landscape undergoes a notable transformation, becoming more vibrant and dynamic. Our use of advanced VR technology adds an immersive, nuanced dimension to our simulations. This capability enables us to prospectively assess the impact of urban interventions within a context that closely mirrors reality, providing valuable insights before actual implementation.

Fig 3, VR scenario 1 pedestrian pathway
VR Scenario
Location: WILMAR PARK, One-north, Singapore
Description: Show realistic green cover with links to the landscape plan, with advanced lighting tools and shading – how the green coverage effects pedestrian walkways.

Fig 4, 360 degree synthetic data frame from Wilmar park Digital twin
In this scenario, we delve into the strategic enhancement of urban green spaces, with a focus on integrating plant life along pedestrian pathways, establishing vertical green infrastructure, and expanding urban parks. This investigation sheds light on the positive effects of vegetation on pedestrian comfort levels within urban environments. To achieve a comprehensive understanding, our Virtual Reality (VR) model encompasses a diverse set of variables, including the Skyview factor, urban heat dynamics, and daily shading patterns. The use of VR technology adds an immersive, experiential layer to these simulations, allowing us to virtually ‘walk through’ future projects and gain first-hand insights into prospective enhancements before they are actually realized.
As a substage, the video shows references to the production of a synthetic data package for validating real data from the streets. The following example for the Wilmar building shows the simulation of green spaces by vertical and green roof. Additional graphic shows the relationship with real street studies of the urban heat map hotspots. The last one shows excerpts of a simulation of Wilmar Park’s green infrastructure over time.
All presented studies could be found in the corresponding section of the WORK PACKAGES.
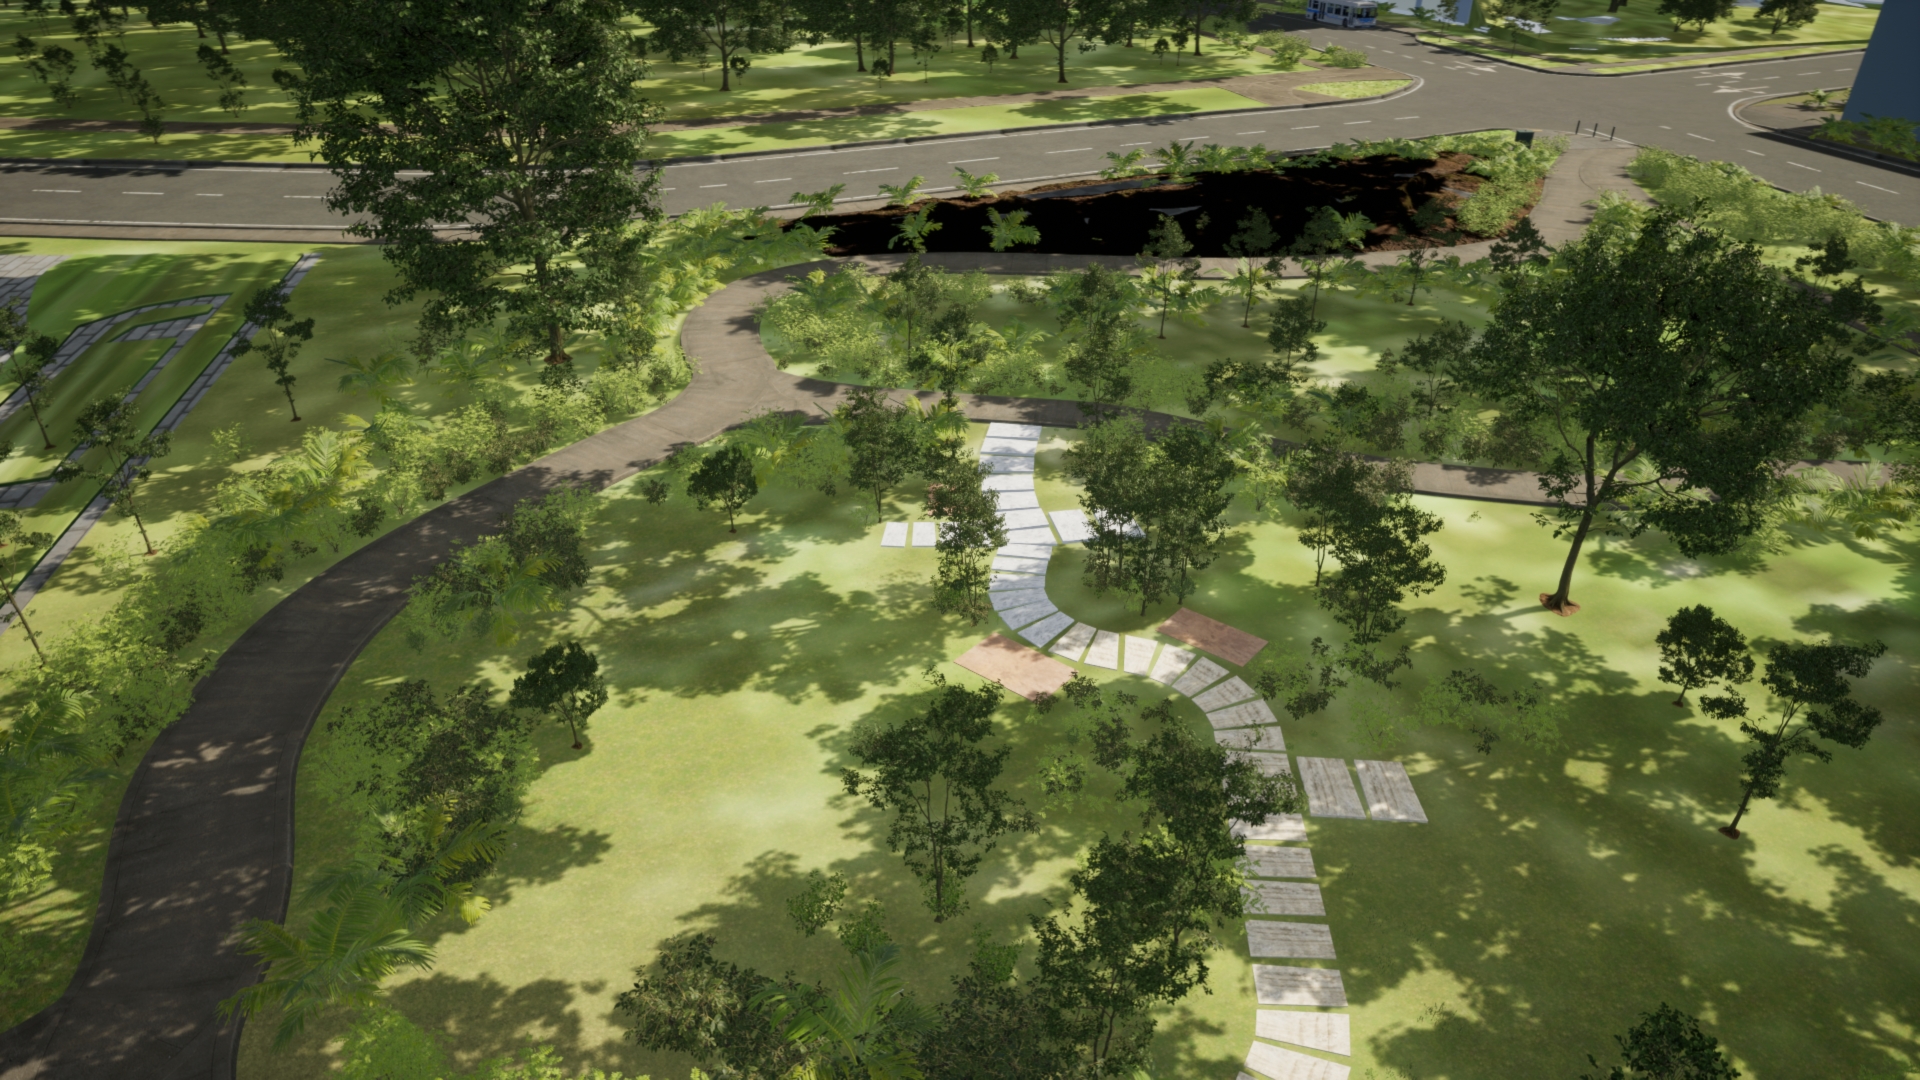
Fig 5, Green infrastructure park simulation