

1. Introduction
With cities expanding and temperatures predicted to rise by 1.5°C by 2050, outdoor spaces in cities could become uncomfortably hot. It would be particularly dangerous for vulnerable groups of society such as the elderly. Urban planners and decision-makers need to use novel technology and scientific knowledge to address this issue and accommodate citizens in outdoor spaces. In such spaces, feeling comfortable depends on several things like the air temperature, humidity, wind, etc. There’s a well-known index called the Physiological Equivalent Temperature (PET) that helps us understand how humans perceive these combined conditions. Using PET, we can figure out the comfort level of an outdoor space for people walking around.
To study these conditions, researchers often take measurements either at one fixed spot (stationary) or by moving around (mobile). While many studies focus on a single spot, understanding an entire district can give us a better idea of comfort levels throughout the area. The study asks the research questions:
How do sustainable integrated districts contribute to outdoor thermal comfort?
Do sustainable integrated districts provide improved cooling services compared to conventional districts on hot days in tropical climates?
2. Methodology
The study compared a sustainable integrated district (one-north) with a conventional business district (Science Park I). The method included an onsite mobile survey, using bicycles equipped with cameras, GPS and tools to measure temperature, humidity, wind speed and other weather-related factors. The cycling route was chosen based on paths that were regularly traversed, especially during the hot parts of the day. The study used existing models (e.g., Rayman model) to estimate how a typical human being (35 years old, 75 kg weight, 1.5 m tall)—standing still, wearing shorts, and a short-sleeve shirt—might feel in the given thermal conditions. The data was analysed using Python and software like ArcGIS.

Figure 1. Instrumentation setup for the parallel mobile survey.

Figure 2. Mobile survey routes: (left) stops for wind speed measurement and (right) labelled sidewalks.
3. Main Findings
The outdoor areas in one-north were generally cooler and more comfortable than in Science Park I. In one-north, it was cooler by about 0.3°C on average. During hot days, the frequency of temperatures above 33°C were less in one-north (8% of the time) compared to Science Park I (24% of the time). The wind was faster by 0.1 m/s on average and more frequent (16% of the time) in one-north, compared to Science Park I (only 4% of the time). The comfort level, measured using a comfort index called PET, was better by 0.8°C in one-north. Moreover, it was rarely ‘very hot’ in one-north (only 1% of the time), but more often in Science Park I (15% of the time).

Figure 3. Spatially distributed physiological equivalent temperature (PET) in one-north and Science Park I: (left) calculated PET and (right) spatially interpolated PET.
4. Reference Links
L. Xu, S. Gopalakrishnan, & T. Schroepfer. (2023). Assessment of overhead environments on pedestrian thermal comfort in a dense urban district. The 11th International Conference on Indoor Air Quality, Ventilation & Energy Conservation in Buildings (IAQVEC2023), 6. https://doi.org/10.1051/e3sconf/202339605012
1 Introduction
With the growth of the population and expansion of urban areas, the natural environment is facing threats that could result in loss of biodiversity, extreme weather events, and the urban heat island effect. As a consequence, people have become increasingly aware of the environmental impact of urban development. Urban planning and design now take into account environmental performance as an essential factor in ensuring that cities are not only liveable but also sustainable.
This research focuses on two significant areas: blue-green infrastructure and outdoor thermal comfort. The first part examines the provision and distribution of green spaces in districts and their role in enhancing accessibility and connectivity. The second part utilises climate data and geo-information from Zurich to illustrate how urban densification affects thermal comfort and identifies critical factors.
2 Blue-Green Infrastructure
2.1 Introduction
Altstetten-Albisrieden is a district with vast greenery due to its unique geography, sloping upwards towards the south, where the Uetiliberg foothills are located, and downwards towards the north, where the Limmat River flows. The area has vast expanses of enclosed woods, intensive agricultural fields, pastures, and residential green spaces. It adopted a “Garden City” concept in the 1930s, creating a low-density but high-quality residential environment and serving as an intersection between Dietikon-Zurich and Höngg-Albisrieden connections.
This study employed a mixed-method approach to examine the blue-green infrastructure in Altstetten and Albisrieden. It presented different types of green spaces, their provisions and allocation, mutual connectivity, and how they affect ecosystems and thermal comfort. The study suggested ideas for future urban development. Some of the study’s findings and outcomes were combined with other work packages to discuss the blue-green infrastructure’s performance in terms of space use and social integration.
2.2 Methods
a) Green space types and provision
Green space in Altstetten and Albisrieden was identified using geographic information from the open-source data of the City of Zurich and Open Street Maps. Two additional parameters, ownership and accessibility, were introduced and categorise green spaces into four main types, including public green spaces, community green spaces, private green spaces and other reserved green spaces, to correspond to the investigation regarding space use.
Two measurements were applied to investigate green space provision:
- Green surface plot ratio (GsPR), measuring the physical surface area of green spaces in each plot and demonstrating the provision of green space on the ground and
- Green plot ratio (GnPR), calculating three-dimensional greenery volume through Leaf Area Index (LAI), thus indicating the greenery intensity of the site.
This study deployed the general LAI values suggested by the National Parks of Singapore (NParks), as shown in Table 1:
Leaf Area = LAI Value canopy Area
GnPr = Total Leaf Area/ Total Site Area
Plant types | LAI value |
Tree | Open canopy: 2.5 Intermediate canopy: 3 Dense Canopy: 4 Intermediate columnar canopy: 3 |
Shrubs | Monocot: 3.5 Dicot: 4.5 |
Turf | Turf: 2 |
Table 1. Leaf Area Index (LAI) values for different plant types. Source: Leaf Assessment Criteria for Developments, Nparks, Singapore
b) Green space network and accessibility
Using Distance Matrices and Nearest Neighbourhood in QGIS, two key findings from a pre-observation study in the district were applied. Firstly, 800 metres (a 10-minute walk) and 400 metres (a 5-minute walk) can be utilised to demonstrate the service area and valuable connections. Secondly, space users’ paths between the three main green spaces were typically public-public, public-community, and public-private. There was little movement between communities and between community and private green spaces.
Given these findings, the study calculated the connectivity by counting pedestrian paths towards public green spaces at three levels: from the main entrances of buildings (including private green spaces) to public green spaces within an 800-metre walking distance, from community green spaces to public green spaces within an 800-metre walking distance, and between public green spaces within an 800-metre walking distance. These paths were accumulated to demonstrate the significance of each public green space within the district’s urban fabric.
c) Fragmentation of natural habitats
The study used a 30-meter hexagon grid to abstract the situation of natural habitat fragmentation in Altstetten-Albisrieden. The study used the ratio between greenery volume calculated with LAI and development intensity consisting of building footprints, grey surfaces, and streets within a hexagon unit to represent the spatial resistance of the unit. The relevant geographic data and information were collected from the open-source data of the City of Zurich. The visualisation of the spatial resistance indicates the fragmentation of green spaces in the district and some possible paths and corridors for the natural habitats crossing the district.
2.3 Findings and outcomes
a) Green space types and provision
Altstetten and Albisrieden prioritise green spaces based on the Garden City concept. As shown in Table 2, over 60% of the district is dedicated to greenery, providing each resident an average of around 130 m2 of green space. Most areas offer approximately 8.0 m2 of collective green spaces, including public parks, gardens, sports fields, and street greenery. The measurement based on LAI (Figure 2) indicates the intensity of greenery, extending and covering the entire residential area. Public utilities such as city parks, schools, and sports fields are critical in providing high-quality greenery.
Space type | Size (m2) | Ground Coverage | |
Public green spaces | Parks and gardens | 36,822 | 0.3% |
Other open green spaces | 108,670 | 0.9% | |
Community green spaces | Community gardens | 1,085,065 | 8.8% |
Private green spaces | Private gardens | 650,877 | 5.3% |
Urban farming fields | 405,720 | 3.3% | |
Other private green spaces | 355,240 | 2.9% | |
Other reserved green spaces | Closed forest | 3,489,788 | 28.3% |
Meadow / Pasture fields | 709,485 | 5.8% | |
Intensive agriculture fields | 53,340 | 0.4% | |
Sports fields | 235,069 | 1.9% | |
Road verge | 70,912 | 0.6% | |
Cemeteries | 124,914 | 1.0% | |
Stocked fields | 80,170 | 0.7% | |
Other greenery | 13,433 | 0.1% | |
Water bodies | 211,524 | 1.7% | |
Building footprints | 1,463,680 | 11.9% | |
Grey surfaces | Roads and rails | 1,709,530 | 13.9% |
Grey landscape | 2,379,823 | 12.2% |
Table 2. Green spaces (types, subtypes, and size) in Altstetten and Albisrieden. Source: Authors Space type.

Figure 1: Green surface plot ratio (GsPR) in Altstetten-Albisrieden

Figure 2: Greenery intensity based on Leaf Area Index (GnPR) in Altstetten-Albisrieden
b) Green space networks and accessibility
The Altstetten-Albisrieden district boasts numerous public green spaces conveniently located near one another, thanks to well-executed urban planning principles. The district’s central area, in particular, has successfully created green corridors. Figure 3 illustrates the size of each public green space with a circle, while the colour represents the number of pedestrian paths leading to it. Dark green indicates more connections, whereas yellow represents fewer. For added convenience, the black and grey lines on the map depict the connections between public, community, and private green spaces that are all within an 800-meter walk.
Public spaces in the central district appear more interconnected than those on the outskirts, making them integral to the city’s overall layout. Despite this, the size of these spaces does not necessarily reflect their importance. This contrast between significance and size could be why certain public green spaces struggle to draw visitors. Therefore, strategic planning based on location and size within the city is essential for maximising the benefits of public green spaces.
Cities have thoughtfully placed gardens and parks to ensure that residents can easily access one within a ten-minute walk, equivalent to 800 meters. Figure 4 visually illustrates the catchment areas and their overlaps of public green spaces. The deeper the shade of green, the more significant the overlap of catchment areas, meaning that those residing in those areas have access to more public green spaces within a ten-minute walking distance.
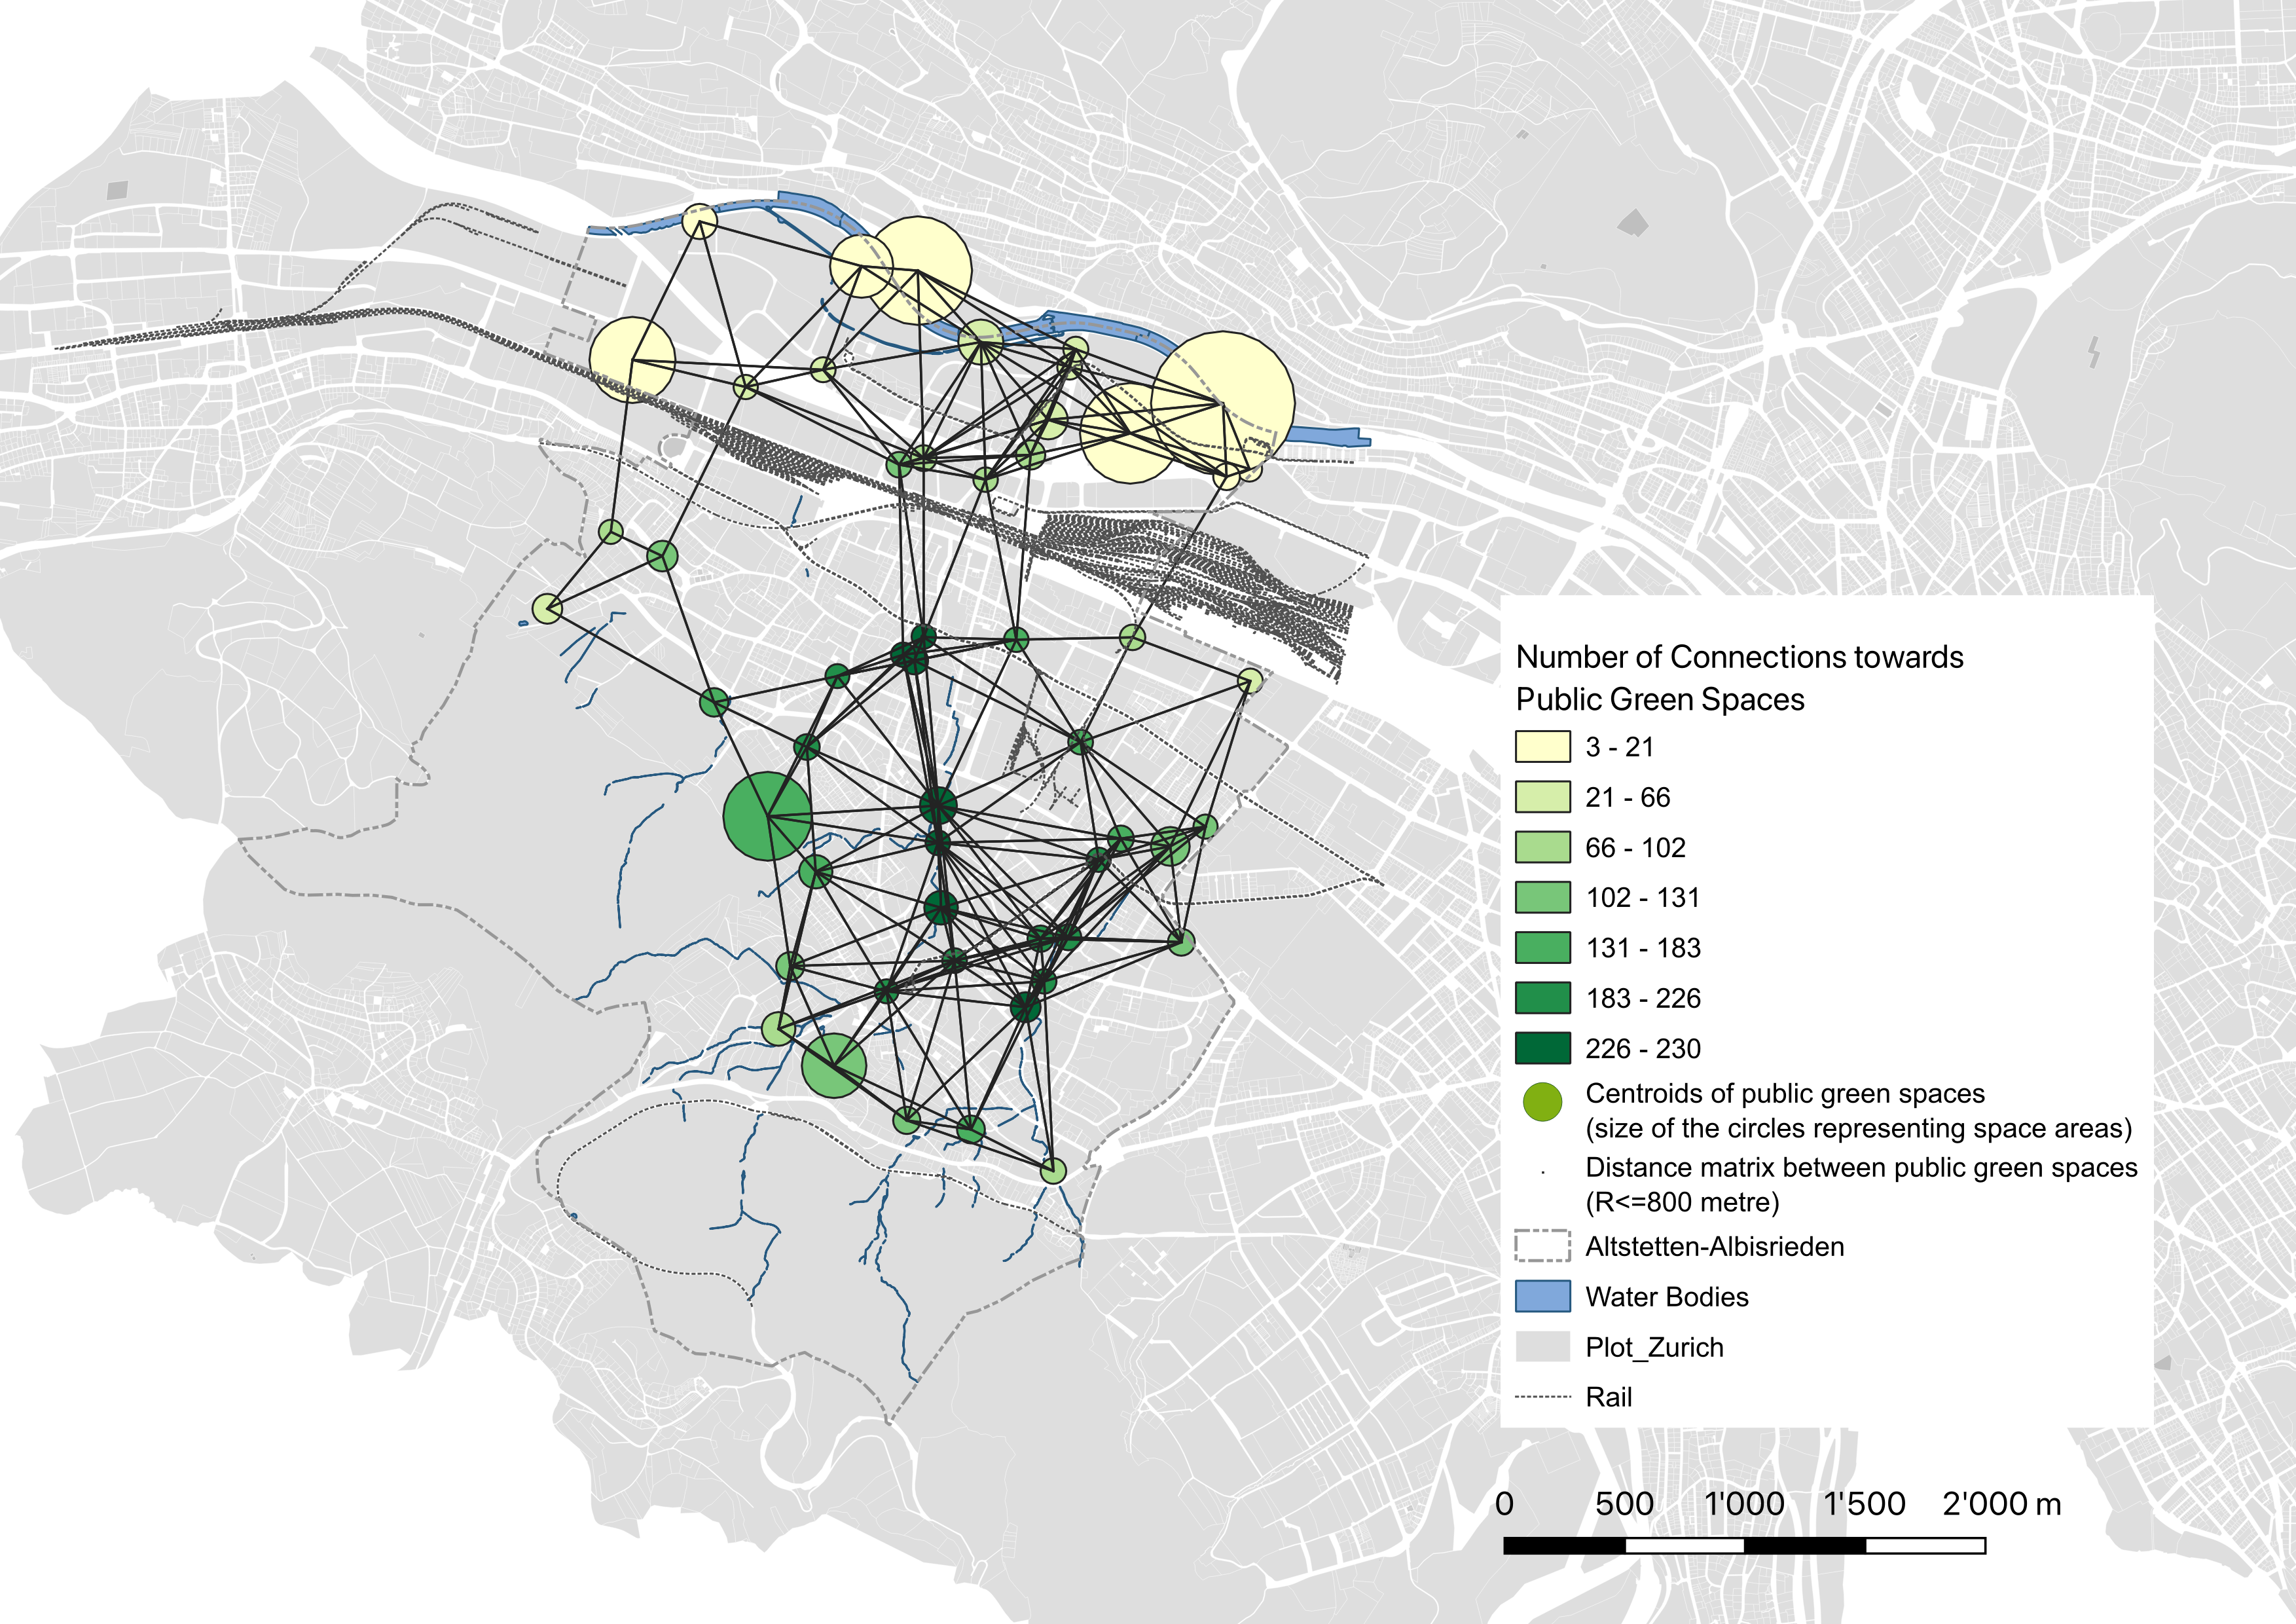
Figure 3: Connectivity between identified public green spaces in Altstetten and Albisrieden: Source: Authors
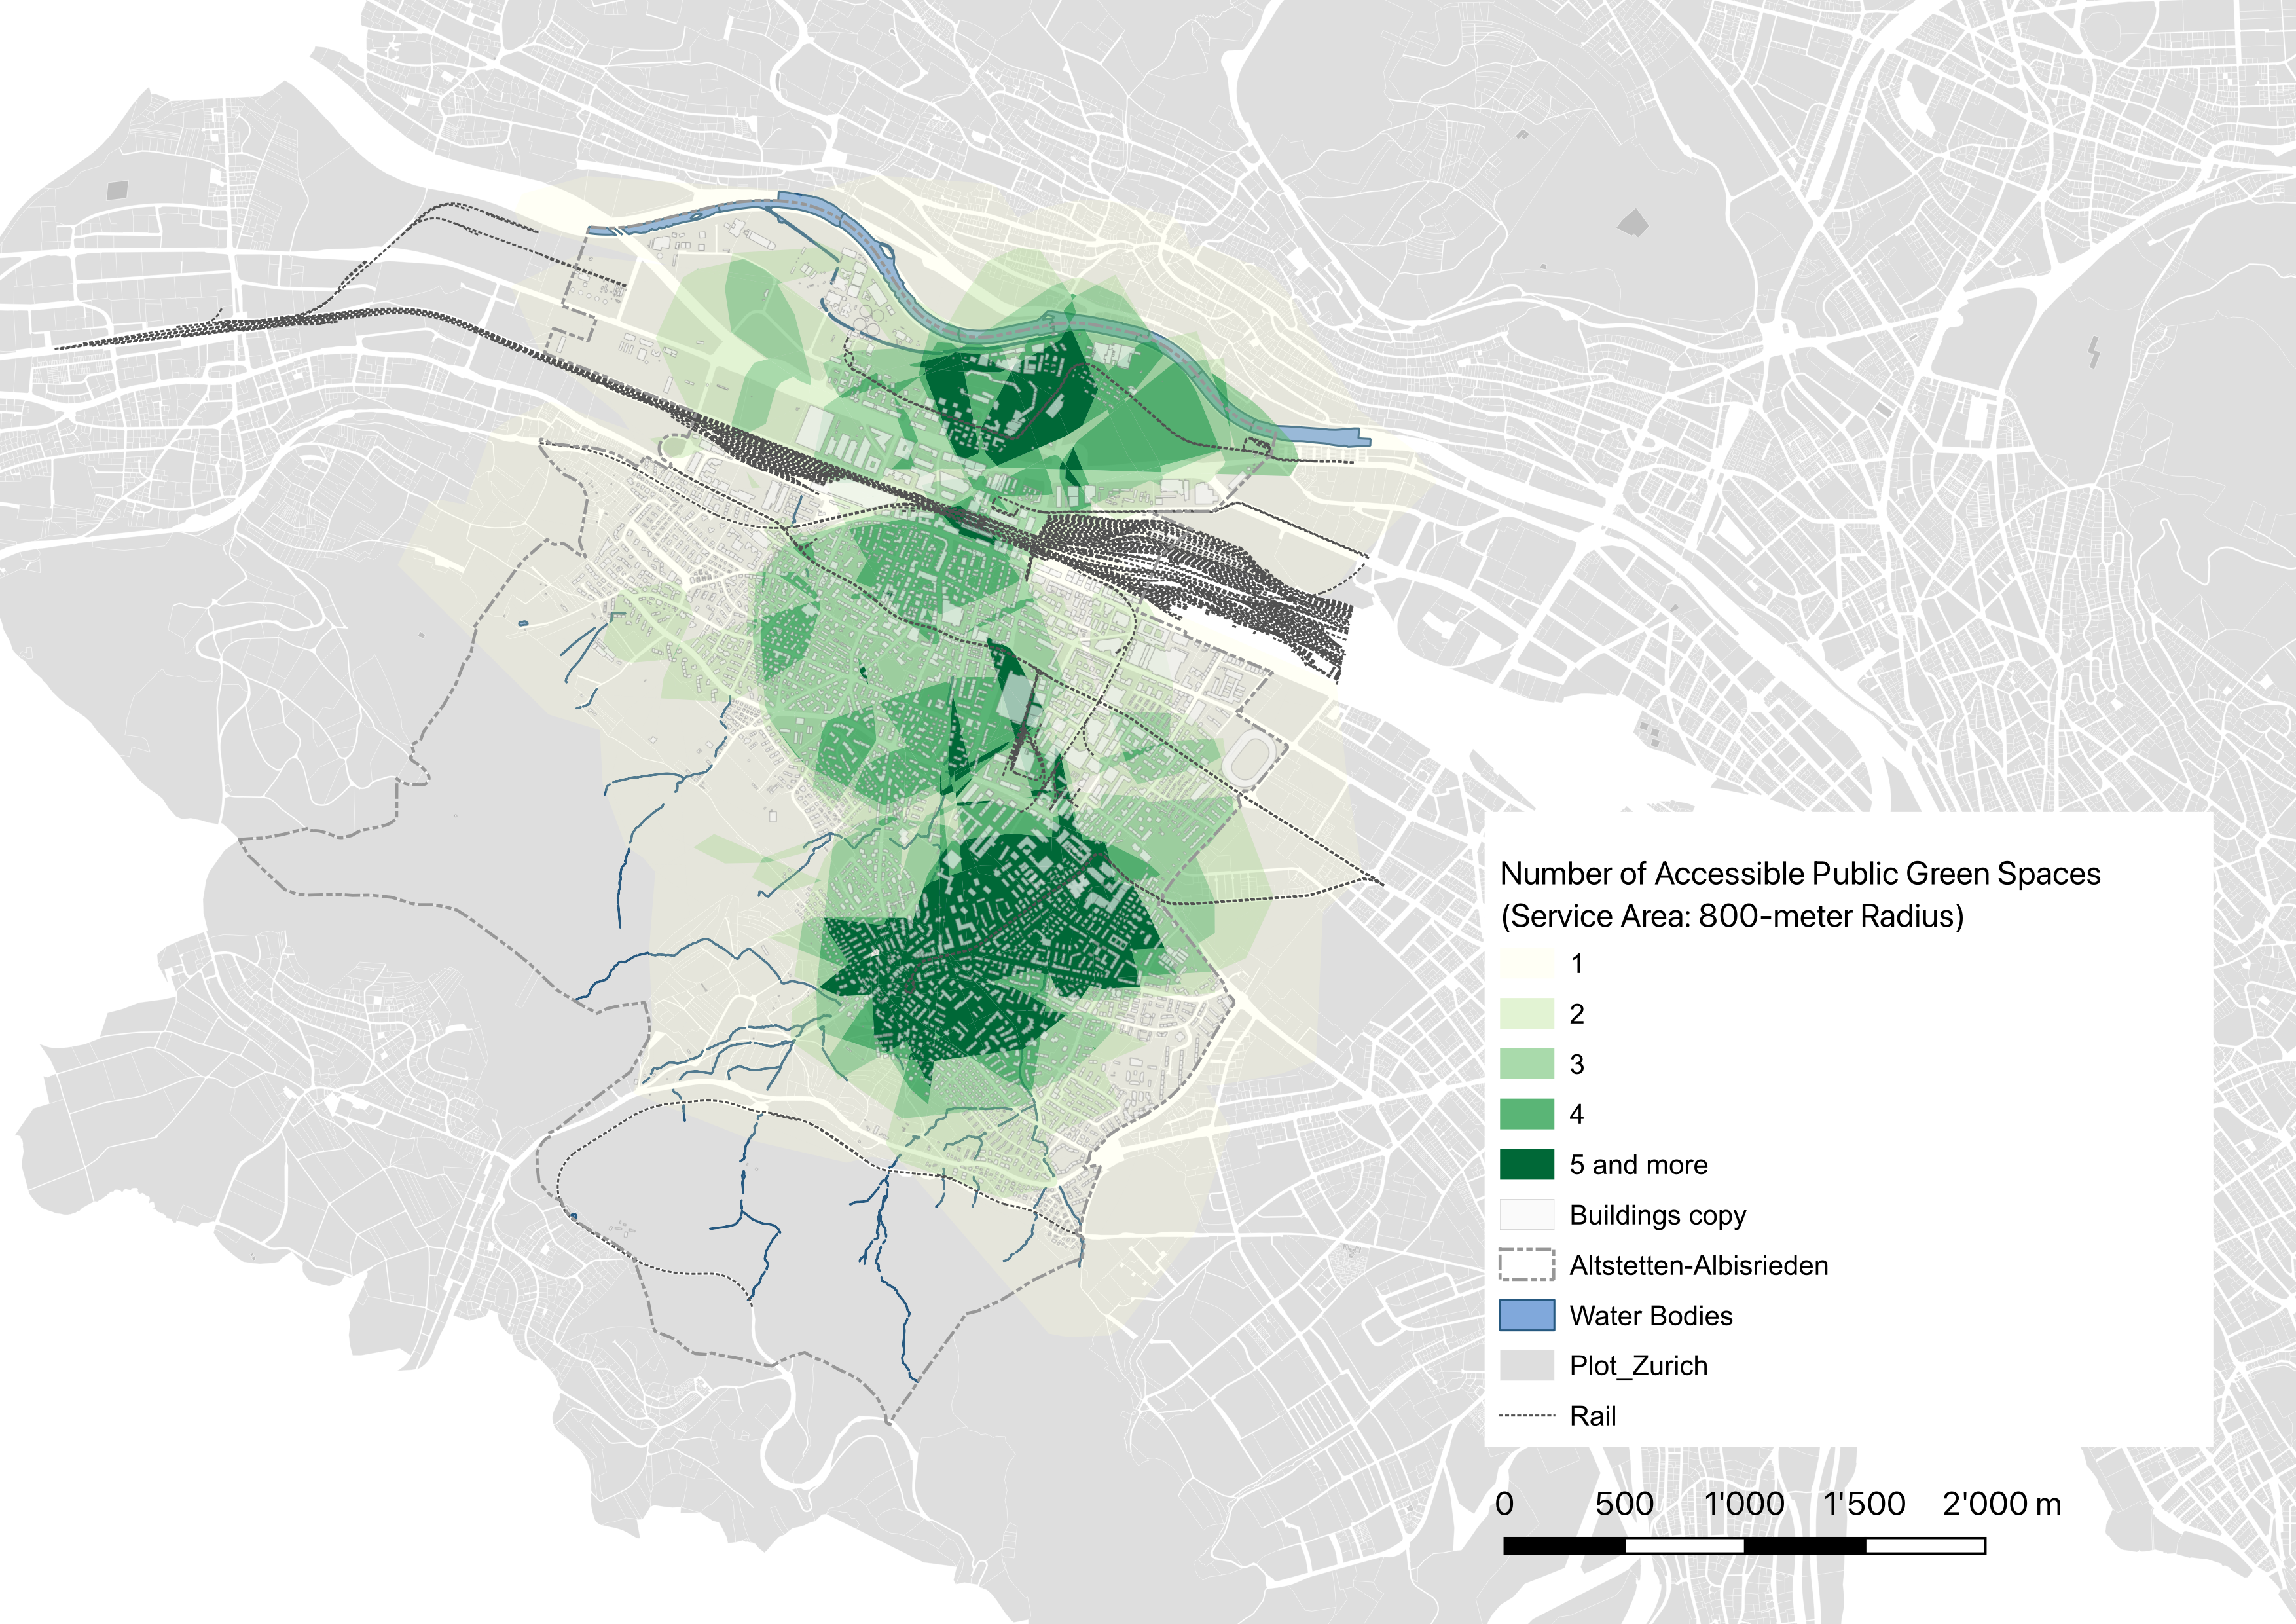
Figure 4: Overlaps of public spaces’ 800-metre radius service areas in Altstetten and Albisrieden: Source: Authors
c) Fragmentation of natural habitats
Urban development causes natural habitat fragmentation because intensively built areas split greenery into small, unconnected pieces, reducing biodiversity. Figure 5 depicts the natural habitat fragmentation in Altstetten-Albisrieden by analysing the spatial resistance against biodiversity crossing the district at a coarse scale. The colour varies from green to brown, suggesting the ratio between greenery volume and development intensity within each unit from high to low, indicating how resistant the unit is against natural habitats from low to high.
The industrial and infrastructure zones, including railways, highways, and main streets leading to the city centre, create a significant divide in the natural landscape. Despite high-quality green spaces scattered throughout the area, obstacles such as tall buildings and large grey surfaces isolate these small patches of greenery, potentially leading to a gradual loss of species diversity. Residential areas with lower building density are more accessible than their industrial counterparts. However, contiguous large green patches along creeks generate green corridors that extend from the foothills of Uetiliberg to the centre of Altstetten-Albisrieden, connecting different parts of the city with lush greenery.

Figure 5: Spatial resistance against ecosystems in the urban area of Altstetten and Albisrieden: Source: Authors
To mitigate habitat fragmentation in urban areas, green corridors should be created and buildings with open spaces should be prioritised. Rooftop green spaces can also balance urban densification and protect natural habitats. It is essential to preserve high-quality green spaces, restore degraded areas, and create new ones during development.
3 Outdoor Thermal Comfort
3.1 Introduction
Urban heat islands occur in cities due to increased energy usage, human activity, and lack of vegetation, leading to the decrease of residents’ quality of life and comfort. However, finding solutions to maintain or improve living conditions in these circumstances is complex. To address this issue in Altstetten-Albisrieden, a climate analysis was conducted to better understand the factors that influence outdoor thermal comfort and well-being. The goal was to identify potential strategies for mitigating the district’s challenges posed by urban densification and heat islands.
3.2 Methods
The study presented the outdoor comfort level in Altstetten-Albisrieden based on the sensor measurement conducted by the City of Zurich and the Canton of Zurich since the middle of 2019. This measure consists of 50 battery-operated sensors in selected areas, continuously measuring air temperature and humidity around Zurich, the nearby urban communities, and the countryside.
The study displayed climate information over the district with a spatial resolution of 50m by 50m, including the air pollution complex and the thermal complex (air temperature and wind speed). This information was synergised to simulate the outdoor Physiologically Equivalent Temperature (PET), indicating the thermal comfort situation in Altstetten-Albisrieden.
3.3 Findings and outcomes
Figure 6 depicts the climate conditions of the district, encompassing air pollution, air temperature, and wind speed, which play a vital role in determining outdoor thermal comfort. The influence of heavy traffic and high building density on thermal comfort in the city becomes apparent. Notably, the air pollution level on the main streets and highways surpasses that of other regions, and the air temperature in the industrial and infrastructure areas is higher than in other localities. Furthermore, buildings act as obstacles to cool air entering the urban area.
Figure 7 displays the simulated PET values with colours ranging from cool blue to hot red. Essentially, PET values increase with development intensity, but green spaces remain cooler than built areas. Two areas in the district require close attention: Altstetten railway station, where PET values are at their highest, and the Freilager high-rise residential development, where PET values show a significant temperature increase in the residential area.
The study revealed that decreasing green spaces and increasing building density in close proximity to the Altstetten railway station and Freilager can result in higher PET value, which in turn leads to reduced thermal comfort. As the population continues to grow and the demand for more buildings increases, maintaining outdoor thermal comfort may become increasingly difficult. However, potential solutions include incorporating more green surfaces and utilising building configurations to introduce cool air flows from mountain areas into the city centre.

Figure 6: Illustrations of climate information of Altstetten-Albisrieden in a 50m grid, including air pollution result (left), wind speed (middle), and air temperature (right).

Figure 7: Simulated Physiologically Equivalent Temperature (PET) in Altstetten-Albisrieden and two areas with critical outdoor thermal comfort.